Built by operators, for operators

You shouldn’t hear about your own outage from a customer.

Neither should we. So we built NOCBox — and we’re giving Lite to Philippine operators, free. See exactly which uplink or VLAN path is dropping packets or slowing down, and get a Telegram alert before the complaints start. No YAML. No public IP. Runs on one host, on your LAN.

Get NOCBox Lite — free Free Lite — 1 site, 5 probes, no card, no expiry
Live on a real ISP production network Lite edition — Telegram alerts Mini-PC, VM, or Docker
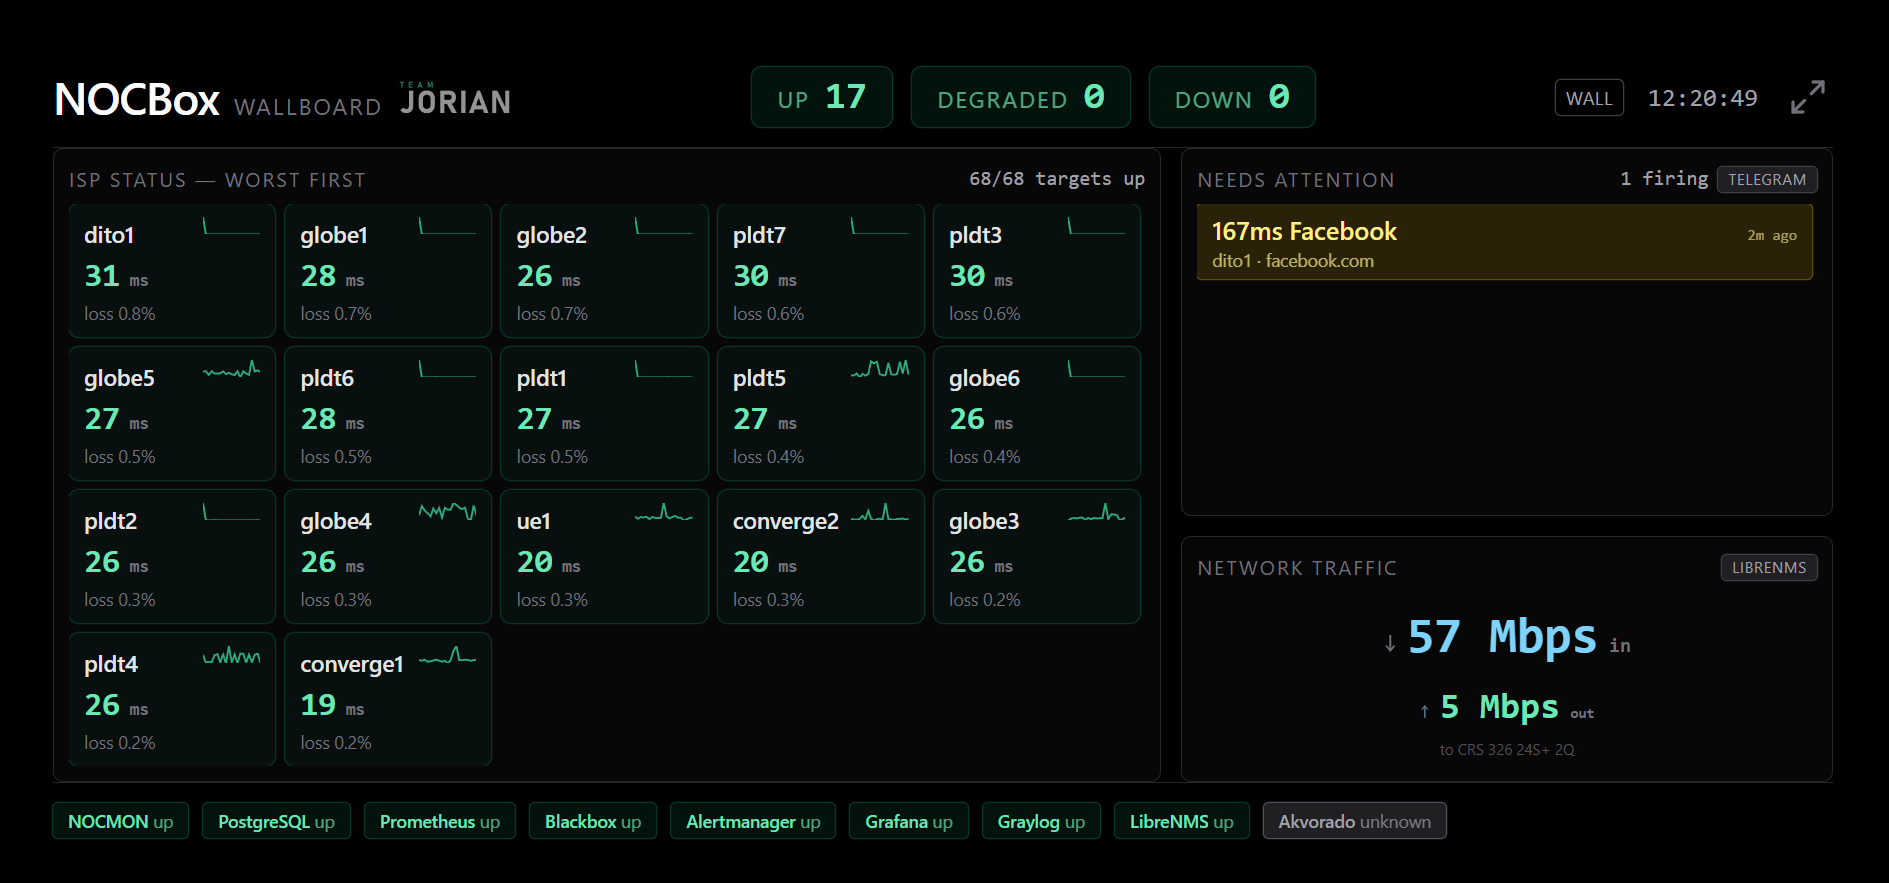
nocbox · wallboard UPDEGRADEDDOWN
Live wallboard showing per-uplink status tiles, worst-first ordering, a firing latency alert, traffic and a service strip
Your whole network on one screen — and an alert before your customer calls.
The real pain

Your customer always finds out first.

“Sir, bagal po net.”
“Sir, wala po signal.”
“Sir, kelan ayos?”

You know the scene — messages flooding in all at once. You’re scrambling: ping here, router login, check the uplink, trace the VLAN path — but the complaints keep piling up.

The outage isn’t the real pain. The real pain is your customer noticed it before you did. You’re guessing while they’re already complaining.

You should know first. Not them.

What NOCBox Lite does

Per-path visibility — and alerts before your customer complains.

01

Per-path visibility

See every uplink and VLAN path: latency, packet loss, RTO/timeout. Not just “up/down” — you know which one is degraded.

02

Telegram alerts

Hits your phone the moment there’s a down or packet loss event, before your customer notices. (Lite = Telegram.)

03

No YAML

You never touch Prometheus / Blackbox / Grafana config. NOCMON generates and applies it for you.

04

Guided probe setup

Got VLANs? Pick the ISP + VLAN, source IP/gateway/interface auto-fills. Flat-LAN? “No VLAN” mode works straight from the box.

05

Dashboard + wallboard

One glance: who’s green, degraded, down. Wallboard mode for your NOC TV.

06

Preview, apply, backup

Preview config before applying. System health, audit logs, backup + host-side restore included.

Runs on VM, mini-PC, or Docker · LAN-only (no public IP) · turnkey install.
Live from a real box

Not a mockup. This is NOCBox Lite.

nocbox · multi-ISP latency
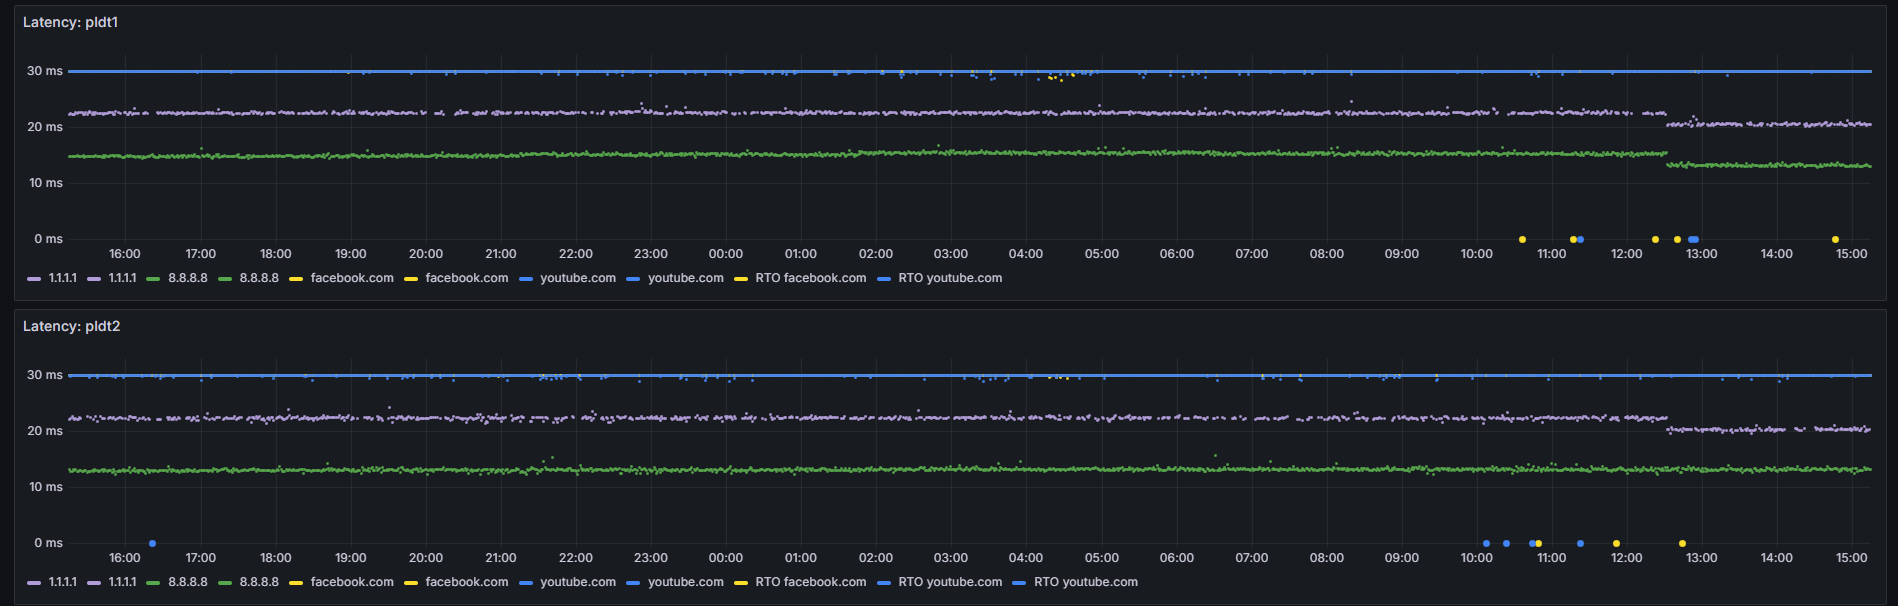
Two ISPs latency to every target over 24 hours, side by side
// per-uplink latency

Every uplink, every target — tracked side by side.

Two uplinks, all your targets, one 24-hour view. You can tell at a glance when one’s going wild while the other holds steady — so you know right away if it’s a path problem or a target problem.
nocbox · ISP check
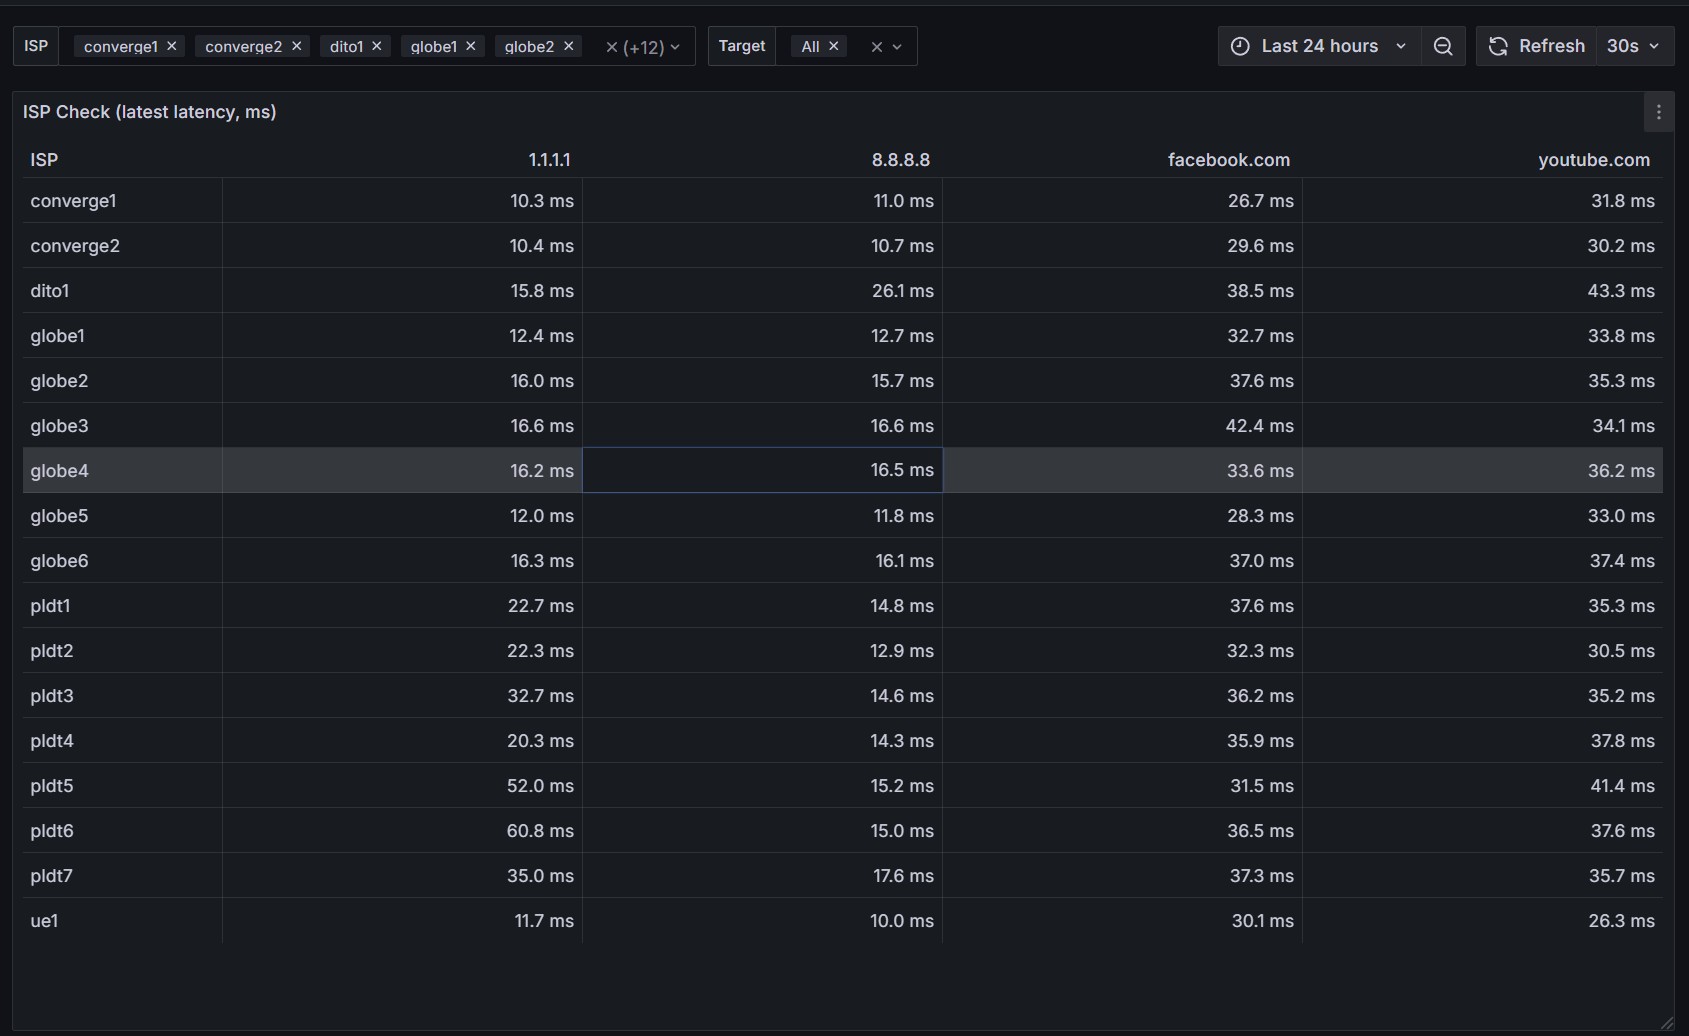
ISP Check table: each ISP across 1.1.1.1, 8.8.8.8, facebook and youtube latency
// at-a-glance table

One glance: which uplink is slow.

A table view per ISP × each target. No scrolling through graphs — you see straight away which uplink is dragging and which target the pain starts at.

nocmon · dashboard
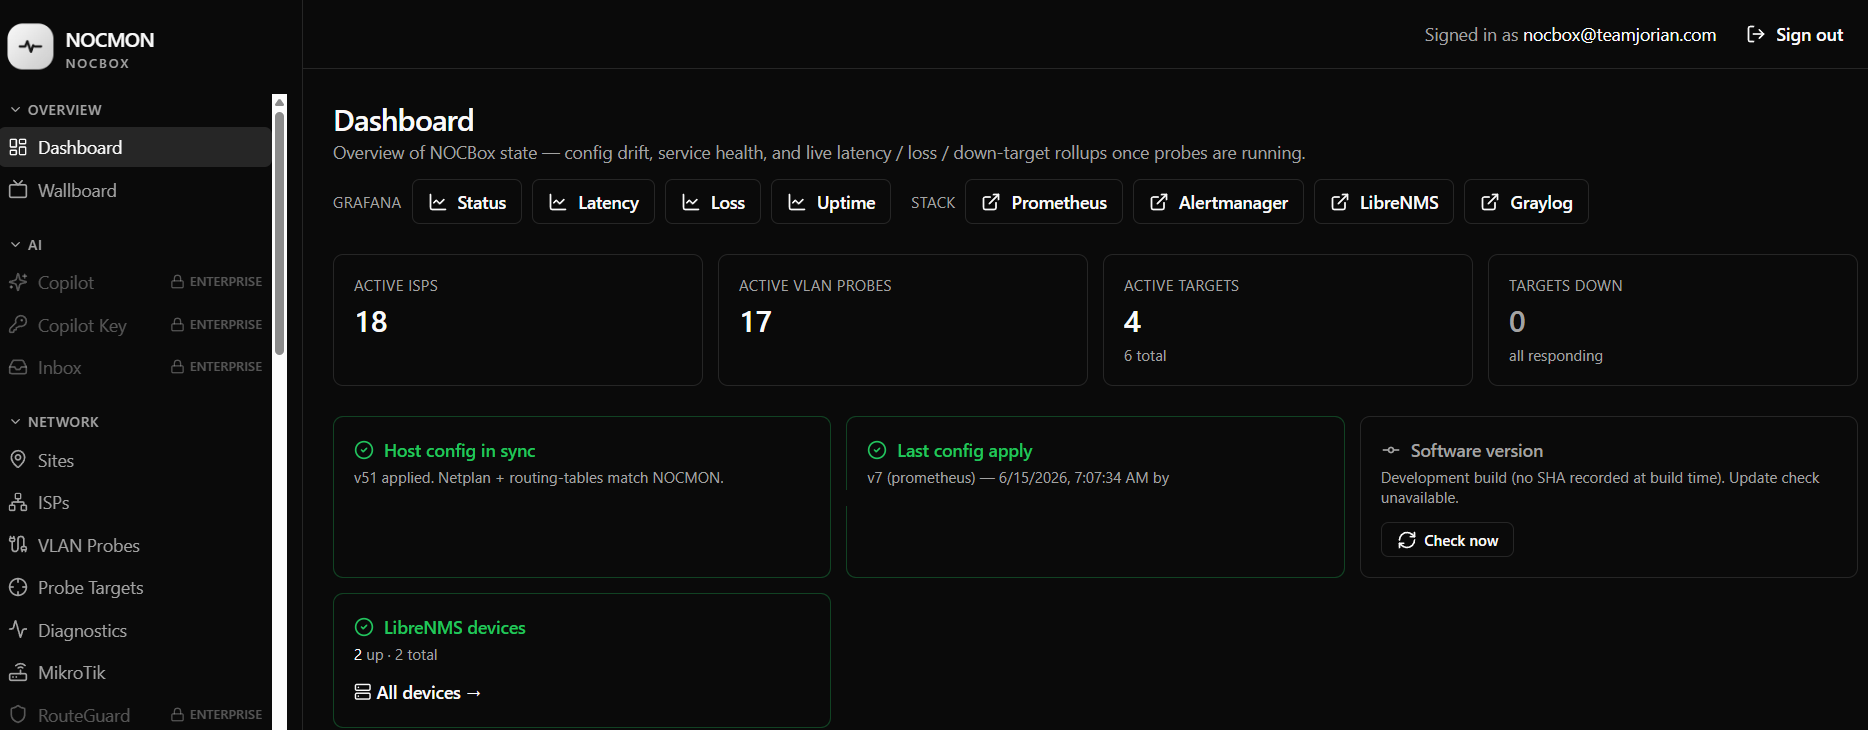
NOCMON dashboard with config sync state, service health and live rollups
// box health

Whole-box health, no guesswork.

Config sync, service health, and live rollups in one panel. You know every part of the box is running — no second-guessing whether your monitoring even works.

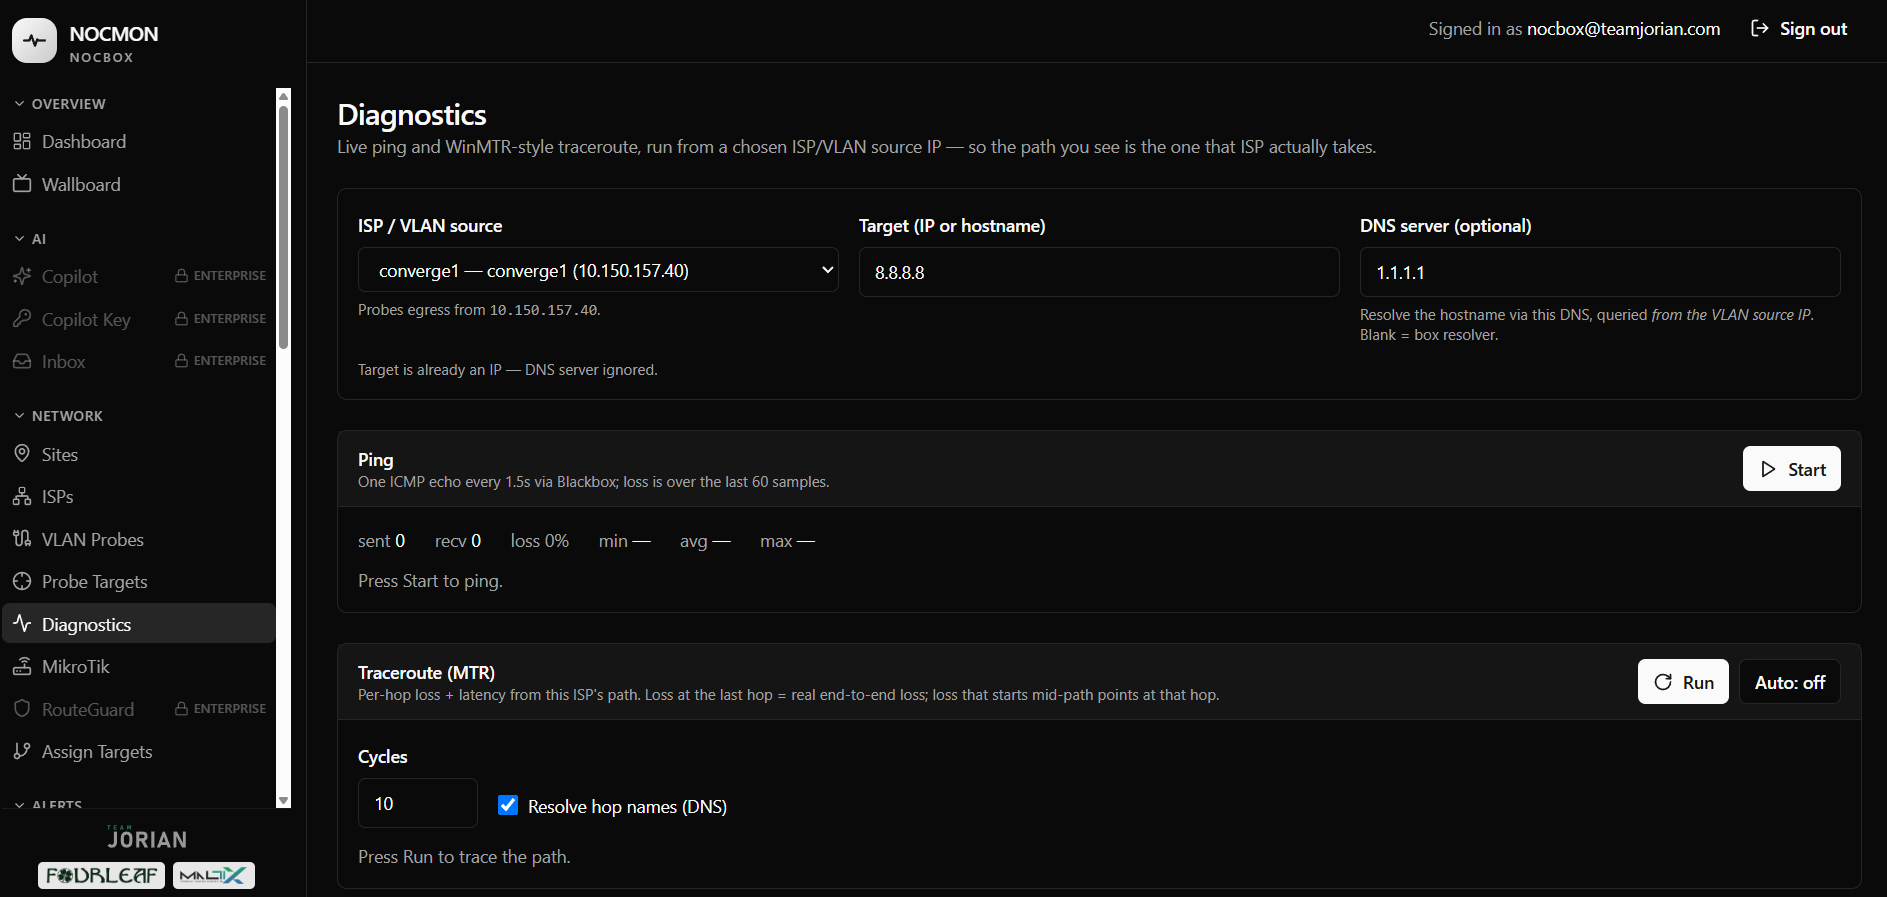
nocbox · diagnostics
Live ping plus WinMTR-style traceroute from a chosen ISP/VLAN source
// live ping + traceroute

Which hop the loss starts at.

Live ping and WinMTR-style traceroute from your chosen ISP/VLAN source. No more SSH-ing into the router — straight from the box, you see exactly which hop the packet loss begins at.

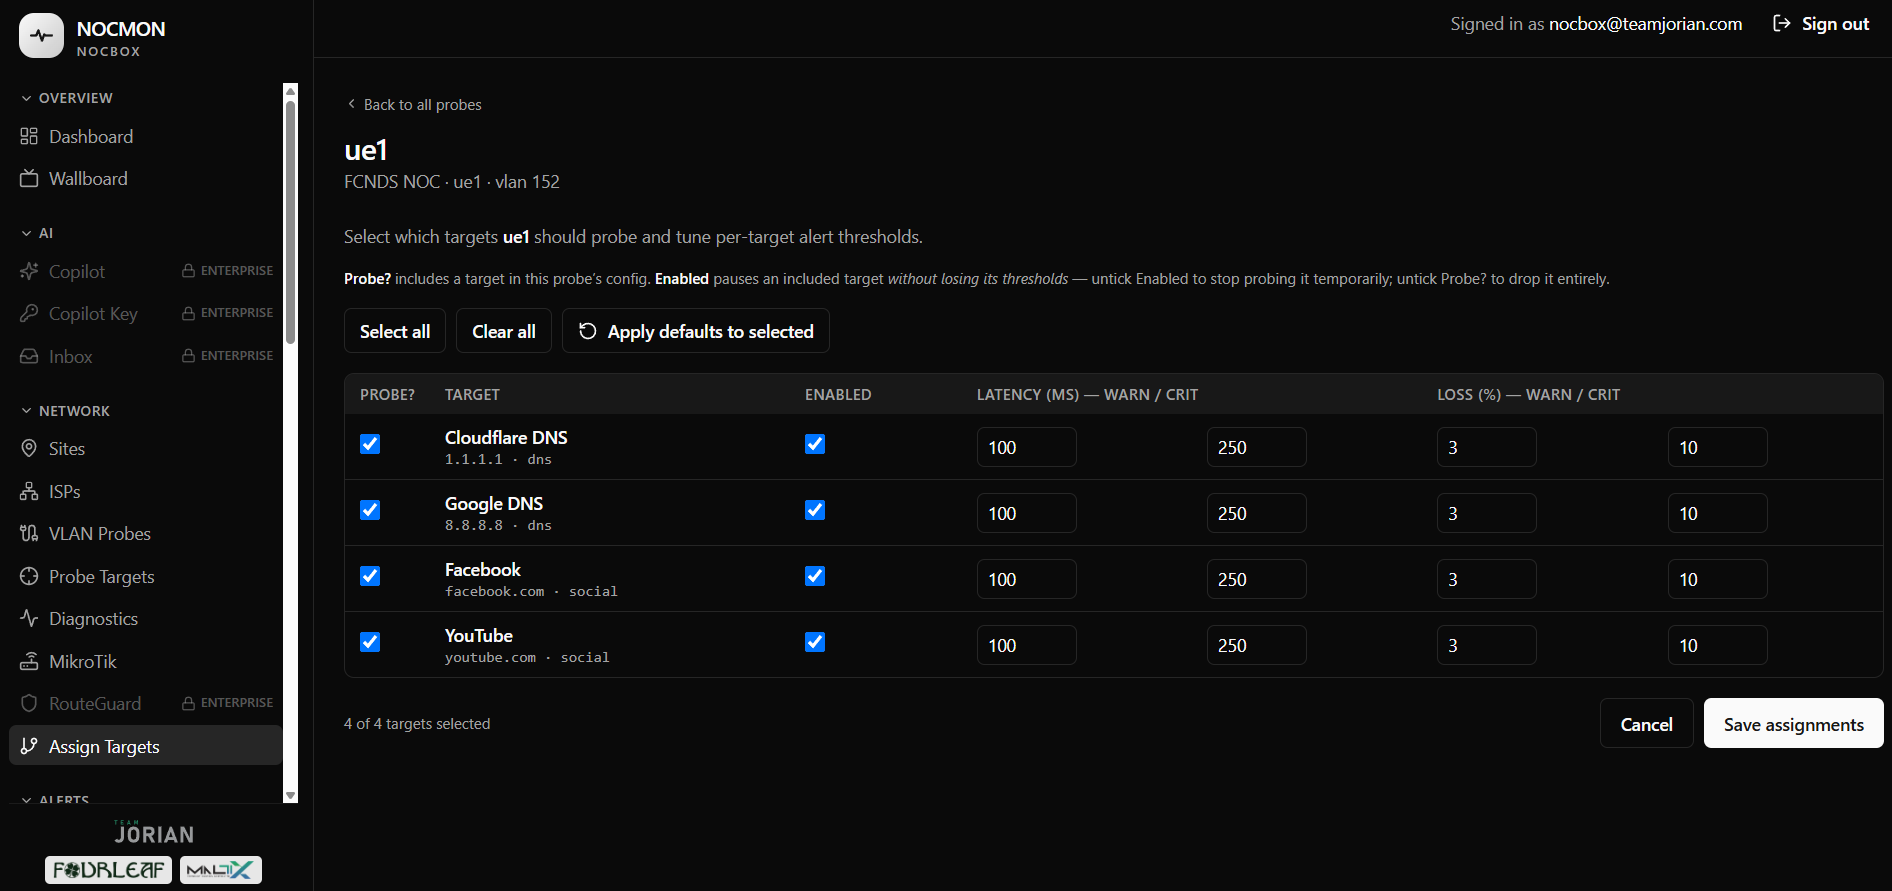
nocmon · assign targets
Assign Targets screen: checkboxes and per-target warning/critical latency and loss fields
// no YAML

No YAML — just checkboxes and thresholds.

Assign Targets: check which target to track, then set warn/crit latency and loss per target. No config file to wrangle — NOCMON builds and applies it.

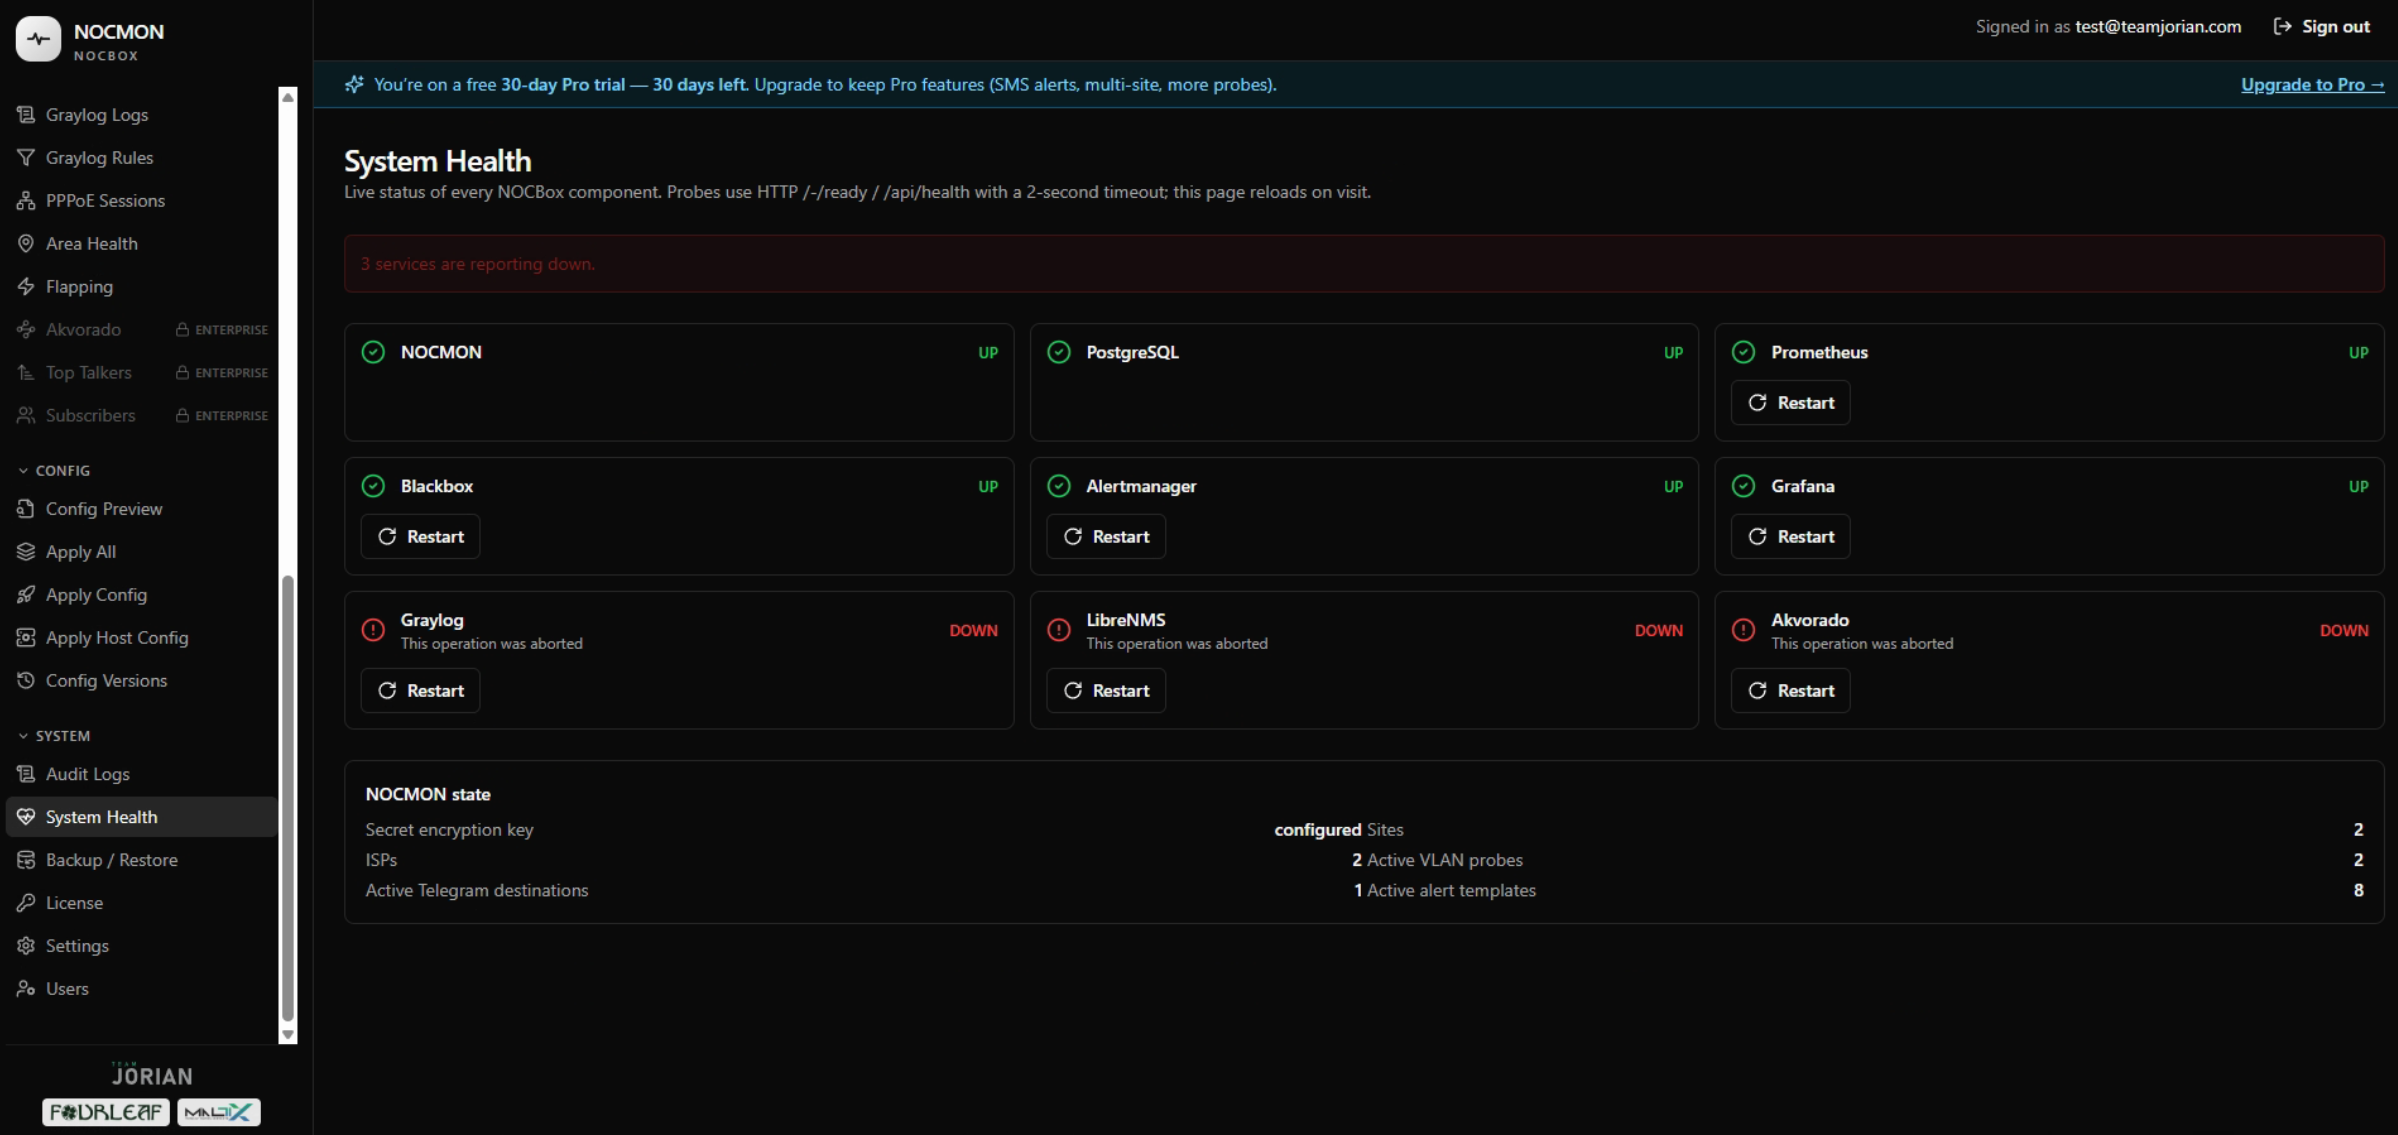
nocmon · system health
NOCMON System Health page: Prometheus, Blackbox, Grafana, Alertmanager all showing UP with restart controls
// every service, one page

Is my monitoring even running?

System Health shows Prometheus, Blackbox, Grafana, and Alertmanager — each with a live UP/DOWN status and a one-click restart. You know your monitoring stack is healthy before you trust what it tells you.

ISP and area names are anonymized / blurred in every screenshot here — only generic carrier shortcodes and internal addresses show. We treat your network with the same respect when you come on as a tester.

The catch

Caught: intermittent.

The hardest thing to catch — latency that comes and goes, random timeouts that clear up by the time you check. Here, there’s nowhere to hide.

nocbox · 24h latency · globe2
24-hour latency scatter showing a stable band, spike clusters and RTO timeout dots sitting at the zero line

Intermittent latency + timeouts caught — before your customer complains.

What was caught
baseline~15 ms · steady band
spikessudden jumps to ~30 ms, repeating — intermittent
RTOtimeout dots at y=0 — packet loss, not a gap
verdictOn-and-off degradation — visible before your customer calls

RTO / timeouts show as a point at y=0 — not a blank. Even when the problem is intermittent, you see the pattern and can act on it.

What’s included in your free tester slot

Full NOCBox Lite, for one host.

  • NOCBox Lite (one host)
  • Install on VM / mini-PC / Docker
  • Guided VLAN probe setup (auto-fill, no YAML)
  • Telegram alerts (down + packet loss)
  • Dashboards + wallboard
  • Config preview & apply + system health + audit logs
  • Backup + host-side restore
  • Quick-Install deck + User Manual (on acceptance as a tester)
  • Direct line to Team Jorian while you’re testing
  1. Applyvia Messenger — we’ll talk first.
  2. Installone-liner on your mini-PC/VM/Docker, then activate.
  3. Add probesset Telegram, done.
// curl one-liner — then activate
curl -fsSL https://raw.githubusercontent.com/TeamJorian/nocbox-install/main/install.sh -o nocbox-install.sh
bash nocbox-install.sh
Read the full Quick Start →
Jorian knot mark
Why it’s free (the honest version)

Built by operators. Free for a reason.

NOCBox is built and backed by Maltix and Fourleaf, under the Team Jorian banner — operators who run real Philippine networks. We built it for our own NOC, and it runs on open-source tools (Prometheus, Grafana) we don’t charge for.

So giving the Lite tier away costs us little. We earn from Pro — for operators who grow into multi-site and unlimited probes — and from running our own networks. A Philippine internet where every operator can see theirs is better for all of us, us included.

The honest limits: Lite is one site and five probes — enough to watch your uplinks. It runs on your own LAN, no public IP. No card, no expiry, no bait-and-switch. Outgrow it and Pro is there; don’t, and Lite stays free.

Reachable: hello@teamjorian.com · Messenger

Get started

Free — and running in minutes.

Lite is free, and it’s yours to keep. One install command and a quick guide and you’re watching your uplinks — no server room, no YAML, no hassle. Small ISP / WISP / FTTH in the Philippines? This is for you.

Not sure yet? Message us — no obligation, no sales talk. Your details are never sold or passed on.

FAQ

Questions, answered.

What hardware do I need?+
~4 cores, 8 GB RAM (16 GB rec.), ~250 GB disk; mini-PC (i5 NUC-class) or VM (Proxmox/VMware/bare metal); Ubuntu Server 22.04 LTS, static IP preferred. Turnkey: curl one-liner then activate.
Who’s it for?+
Any small ISP / WISP / FTTH operator in PH with a real network. It’s free — message us and we’ll point you at the install.
What do I get?+
Full NOCBox Lite on one host — 1 site, 5 probes, dashboards, Telegram alerts — plus the Quick-Install guide and User Manual. Free to keep. Feedback’s welcome, not required.
Server room or public IP?+
Neither. LAN-only.
Do I need VLANs?+
No. Multi-VLAN → per-VLAN source-bound probes (auto-fill). Flat-LAN → “No VLAN” mode straight from the host. Works on single-NIC.
Do I need to know Prometheus/YAML?+
No. No YAML — NOCMON handles it.
SMS or email alerts?+
Lite is Telegram only. (Email is Pro; SMS is Enterprise.)
What if the host goes down?+
There’s a system health view; host it on 24/7 hardware.
Does this replace Grafana/Zabbix?+
No — it runs Prometheus, Blackbox, and Grafana for you and generates their config. A visibility + no-YAML layer, not a replacement.
What do you do with my data?+
Your contact details are only used to help you get started — never sold or passed on. Screenshots here are anonymized (no real ISP or area names).
How do I start?+
Message us on Messenger — no obligation, no sales talk.
Free, foreverUp and running in minutes Get it free